The Traffic Distribution section of the Traffic & Market Toolkit offers dasbhoards to help you break down where a domain’s visitors come from and how they interact with content across different marketing channels.
With dedicated dashboards for each traffic source—AI Assistants, Referral, Organic Search, Paid Search, Organic Social, Paid Social, Email, and Display Ads—you can assess the role each channel plays in driving performance.
Whether you're optimizing a campaign, analyzing a competitor, or benchmarking your own channel mix, these dashboards provide valuable insights into traffic sources, trends, and content engagement.
You’ll uncover:
- Which channels are delivering the most traffic
- How engagement differs by source and device
- Top-performing pages within each channel
- Top keywords (where applicable)
- Shifts in strategy over time
These insights help marketers fine-tune acquisition strategies, allocate budget more effectively, and benchmark channel performance across domains.
Getting started with the Traffic Distribution dashboards
The Get Started menu is your entry point into the Semrush Traffic & Market Toolkit. It’s designed to help you quickly enter domains and move into your analysis of their traffic and marketing performance.
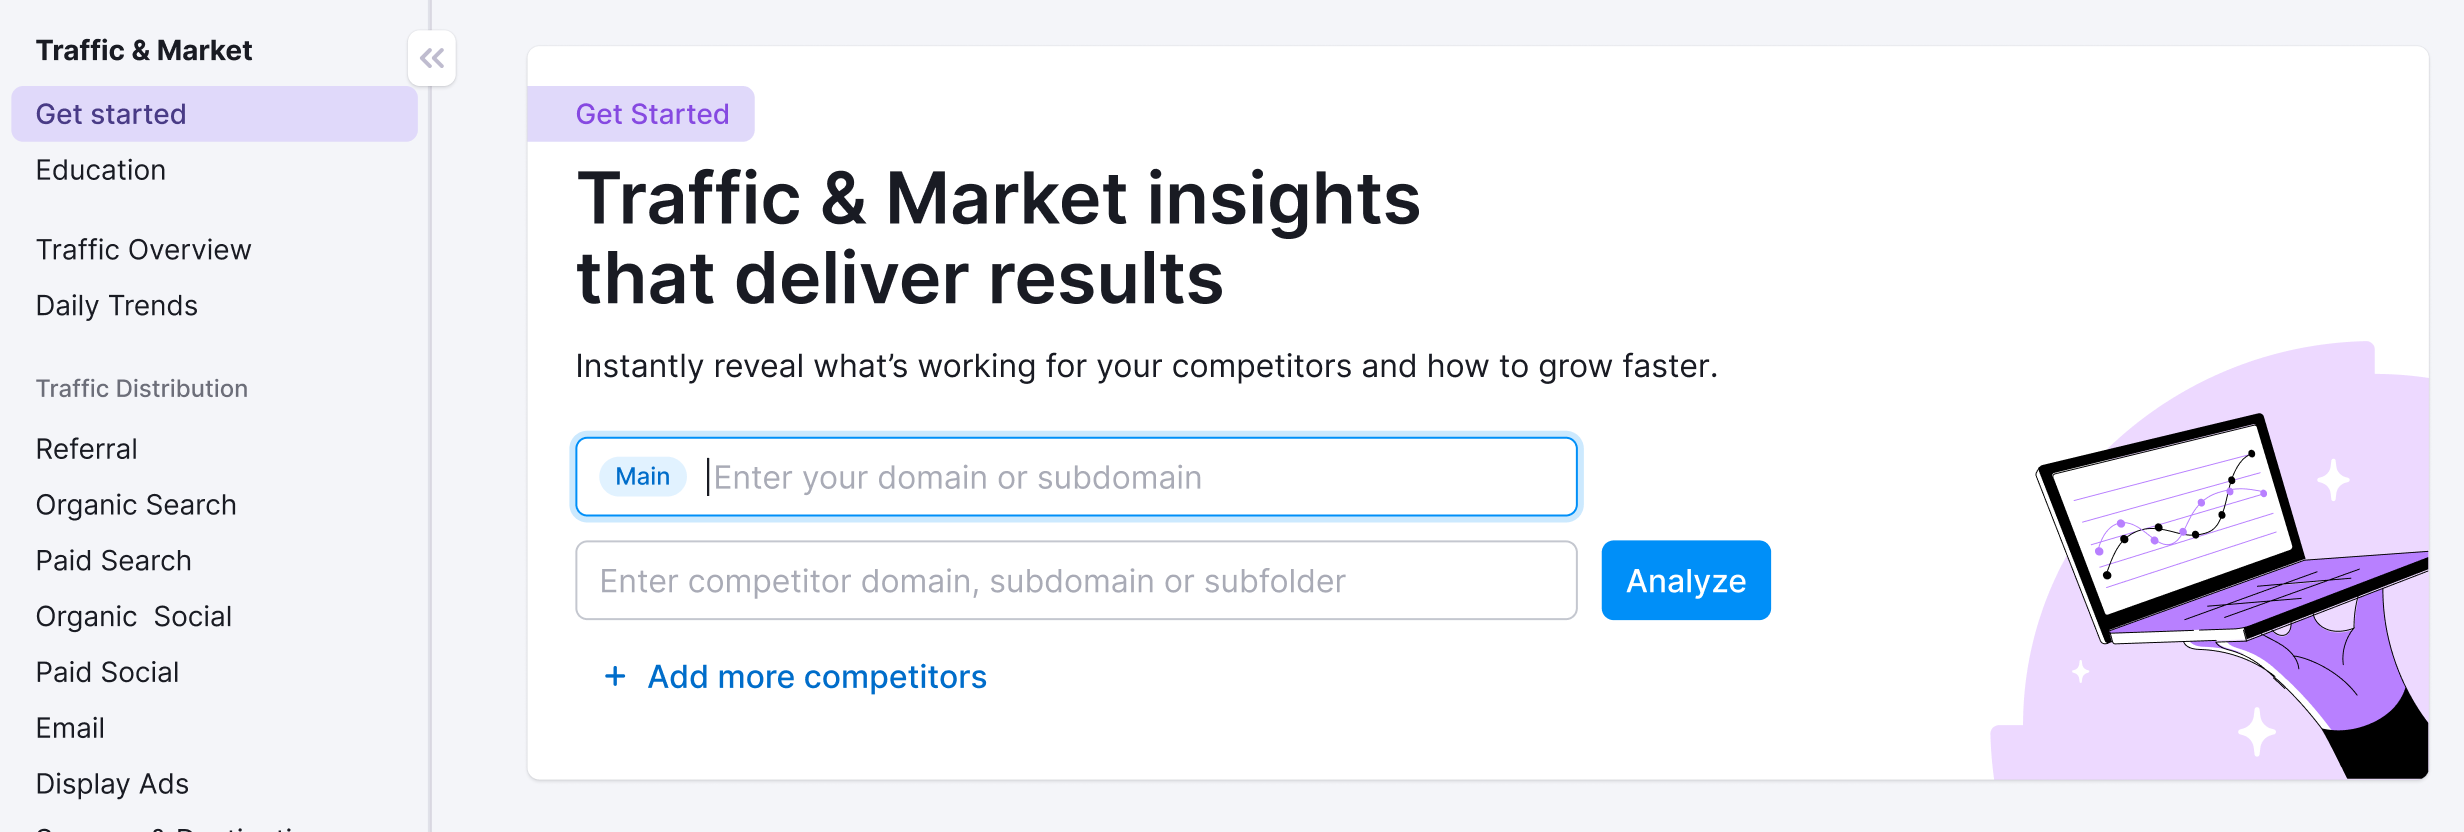
You’ll use this page to kick off your analysis—it’s your launchpad into the entire Traffic & Market experience.
If you haven’t started any analyses yet, you’ll see a search panel where you can:
- Type in a domain — Start by entering the main domain you’d like to analyze
- Add additional competitors — Use the “+ Add more competitors” link to compare multiple sites at once
- Click the “Analyze” button — This will pull up dashboards with data and charts, starting with the Traffic Analytics dashboard
If you’ve already entered domains into the toolkit, you’ll see them saved as “Folders” and you can access them anytime.
In this case, you’ll see your saved folders listed on the Get Started screen. Click any one of them to jump straight into your dashboards and pick up right where you left off.
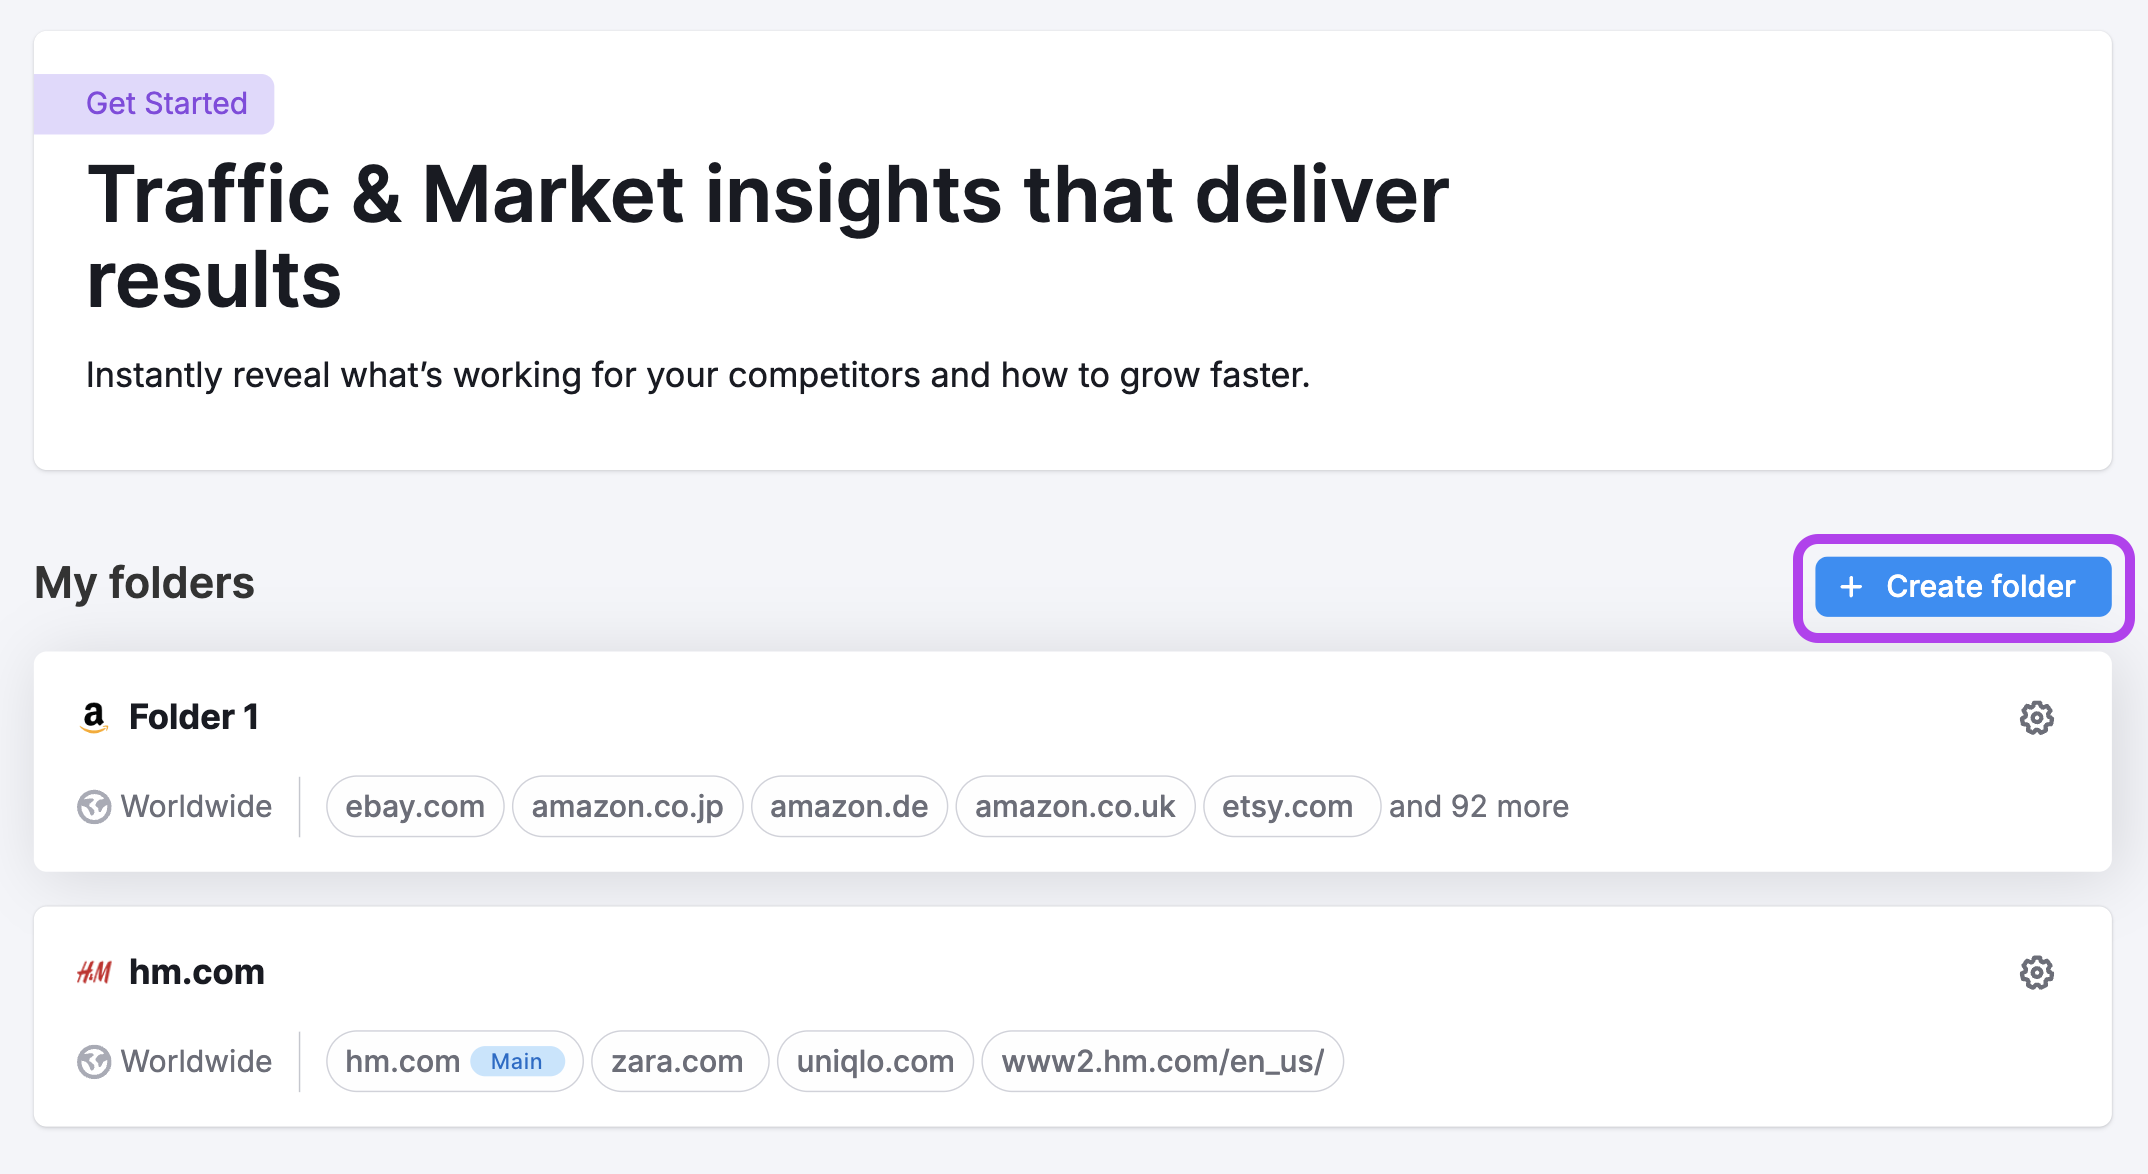
Use the “Create Folder” button to start a new project whenever you're analyzing a new domain or market.
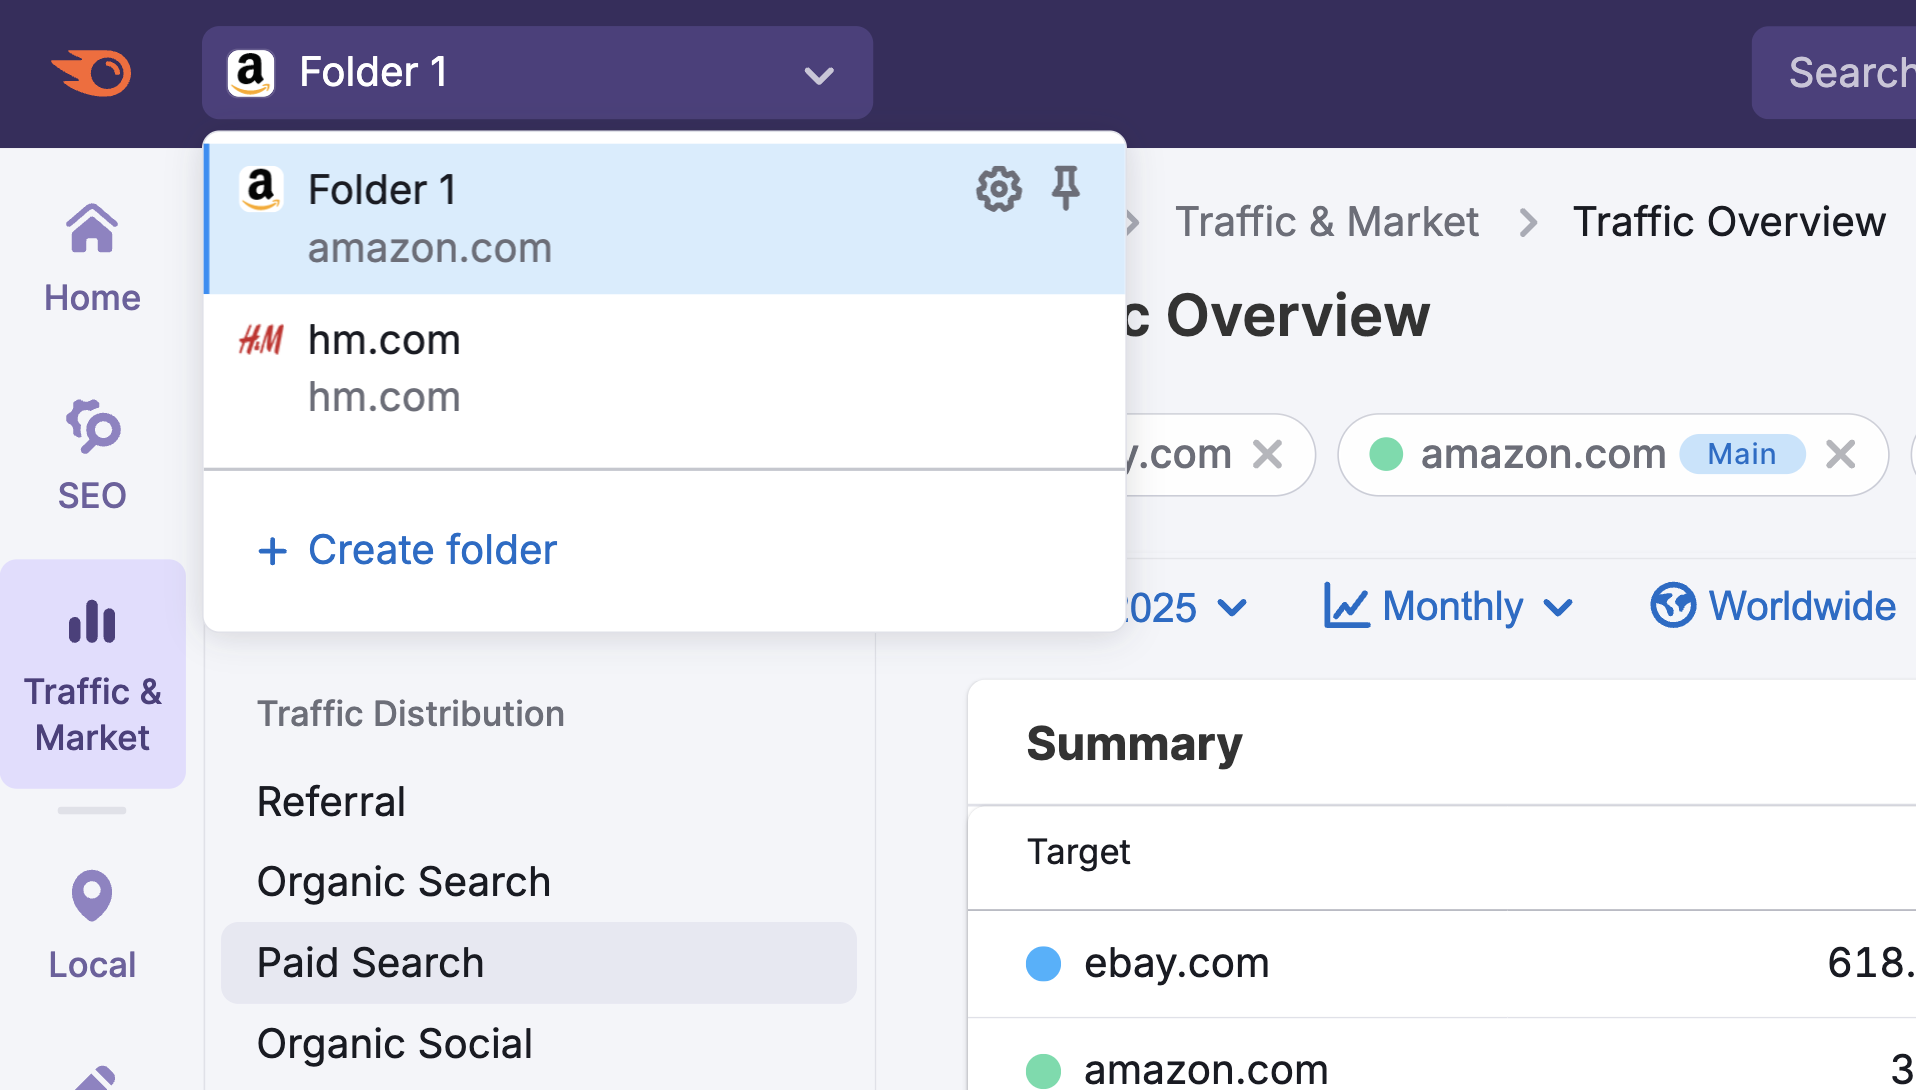
Note: At any time—no matter which dashboard you're on—you can click the Folders dropdown in the upper left corner of the dashboard to select another folder or add more competitors to your analysis without losing your place.
What dashboards and data will I find in the Traffic Distribution section?
The Traffic Distribution section includes a dedicated dashboard for each of the seven main traffic channels. Each dashboard breaks down performance trends, user behavior, and top content by source.
You’ll find the following dashboards:
- AI Traffic Dashboard
- Referral Dashboard
- Organic Search Dashboard
- Paid Search Dashboard
- Organic Social Dashboard
- Paid Social Dashboard
- Email Dashboard
- Display Ads Dashboard
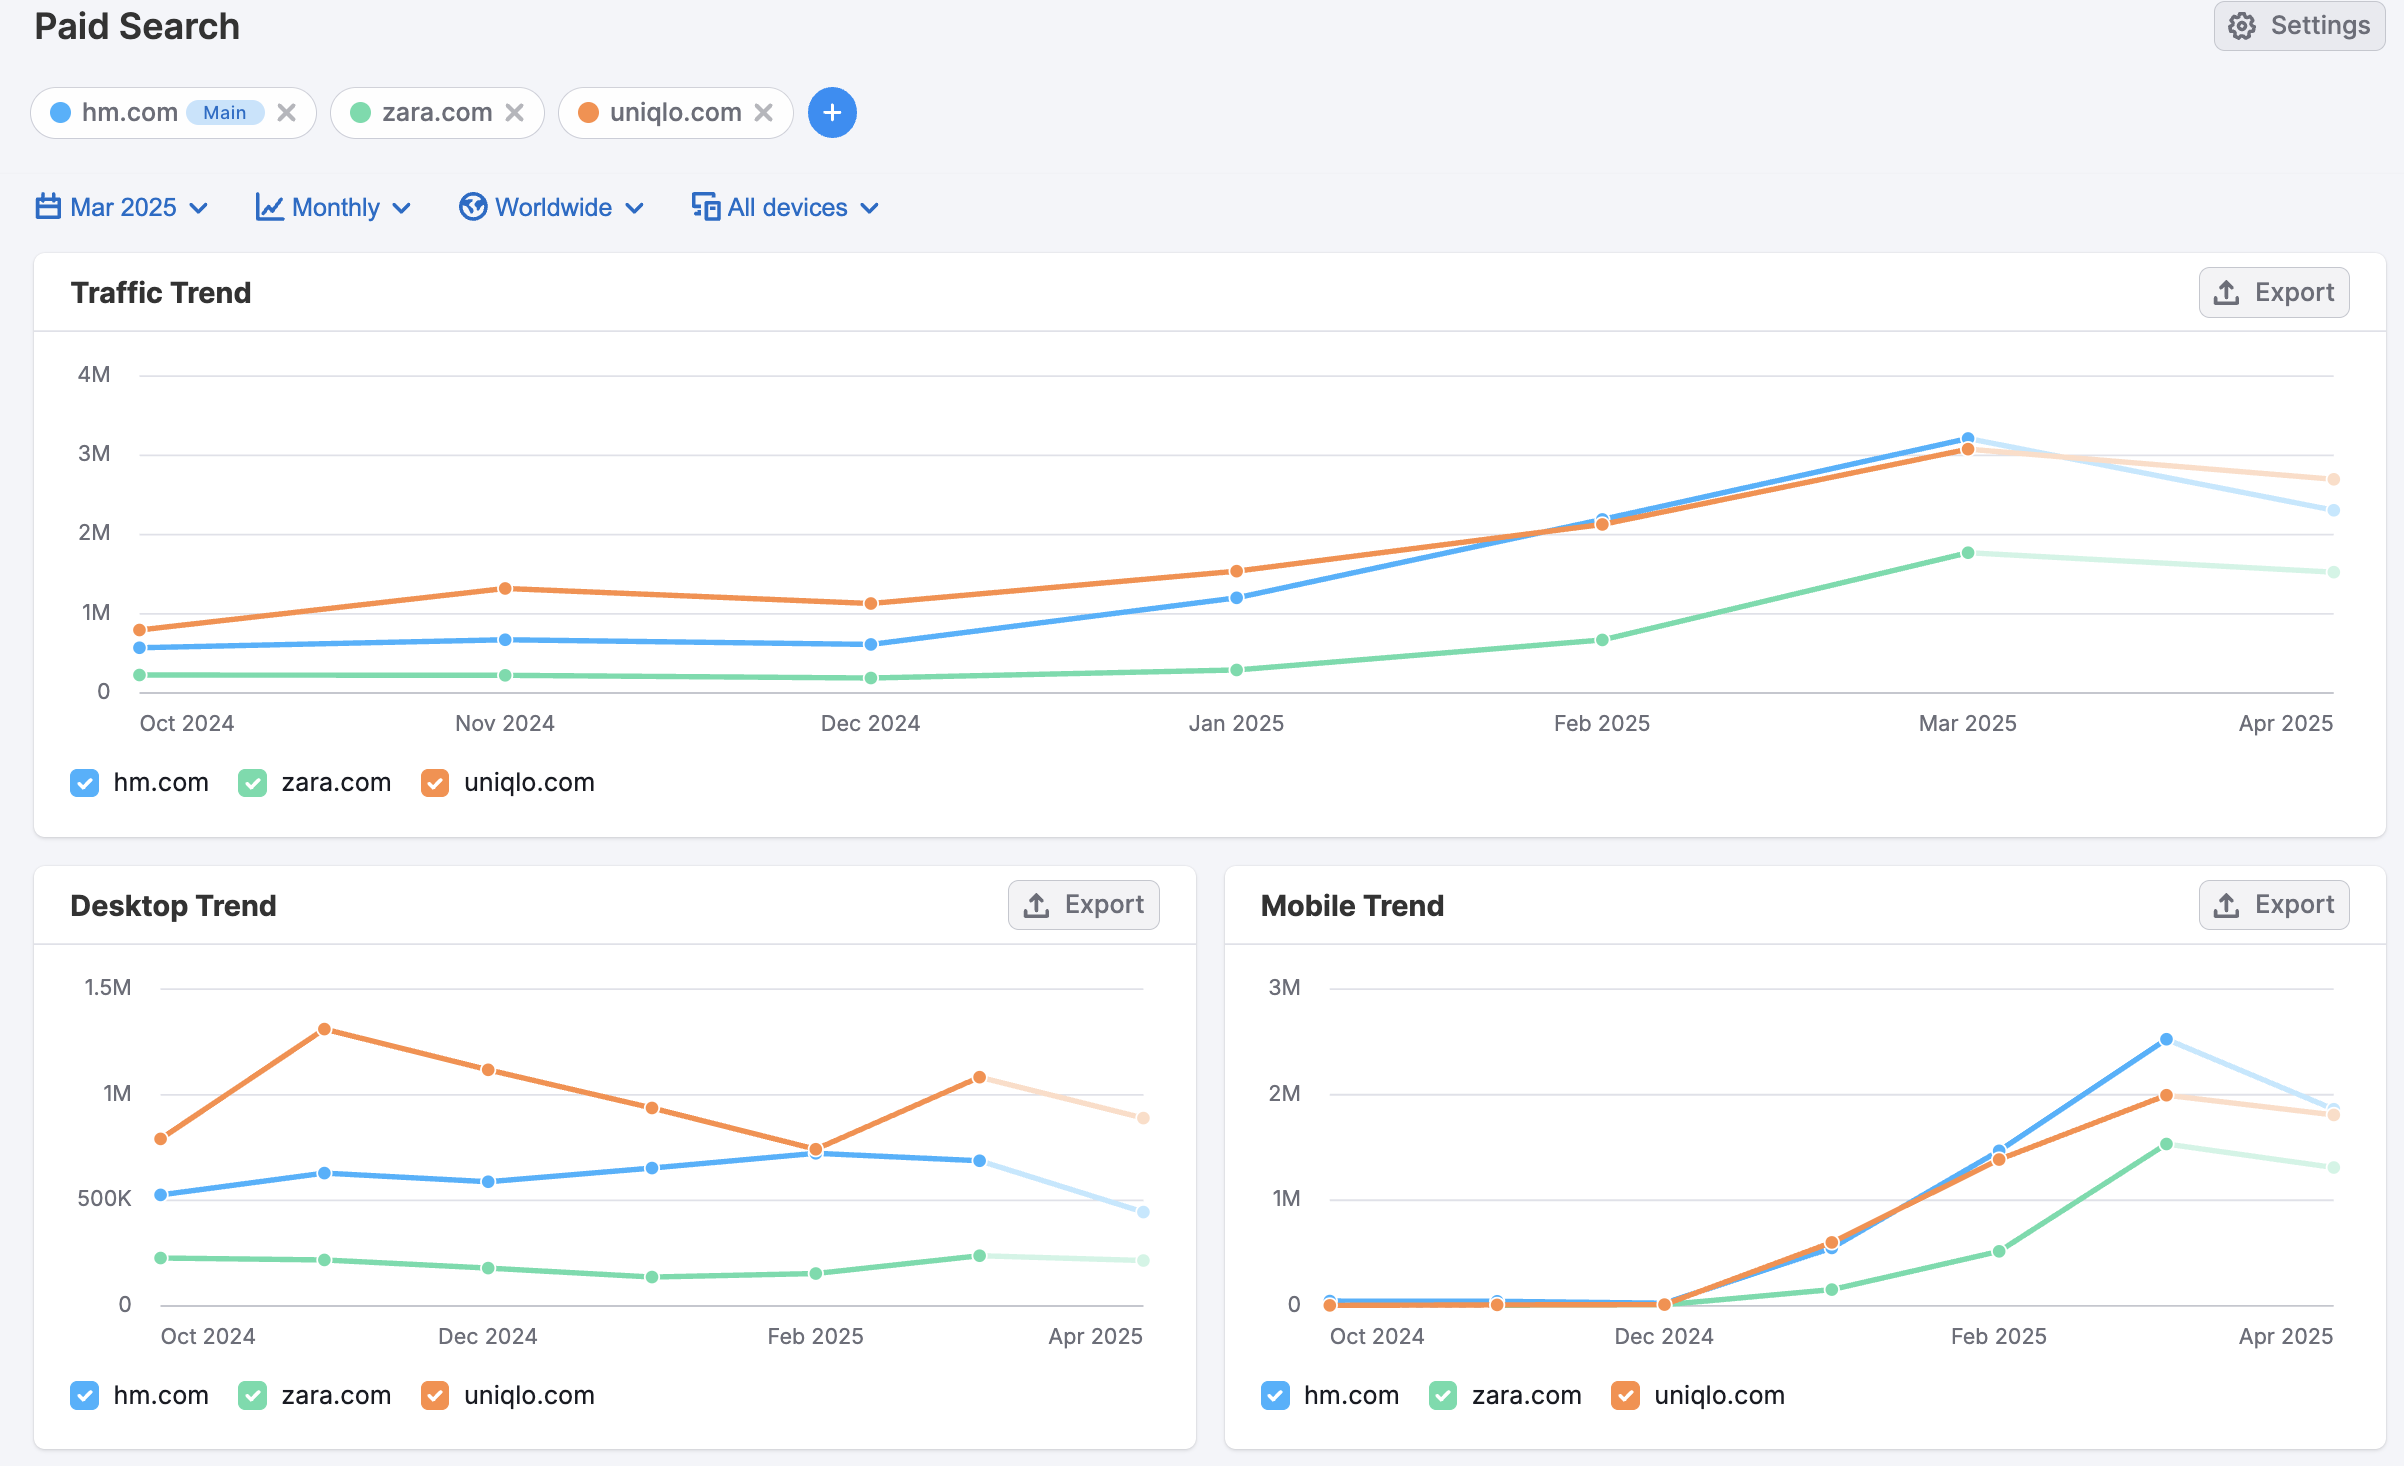
Each dashboard includes a detailed view of how its respective channel contributes to a domain’s performance. You’ll find the following data across all dashboards:
- Traffic Trend – Track how traffic from the selected source changes over time
Desktop vs. Mobile Breakdowns – See how device usage impacts engagement - Trending Pages – Identify which landing pages are gaining or losing traction
- Top Sources – Discover the top referrers, platforms, or placements driving traffic
- Top Keywords – (Available in Organic and Paid Search dashboards) View the search terms bringing users to the site
These insights help you evaluate performance, uncover opportunities, and refine your channel strategies.
You’ll also find the Sources & Destinations Dashboard, which helps you visualize the full user journey—showing where traffic is coming from before reaching a domain and where users go after they leave.
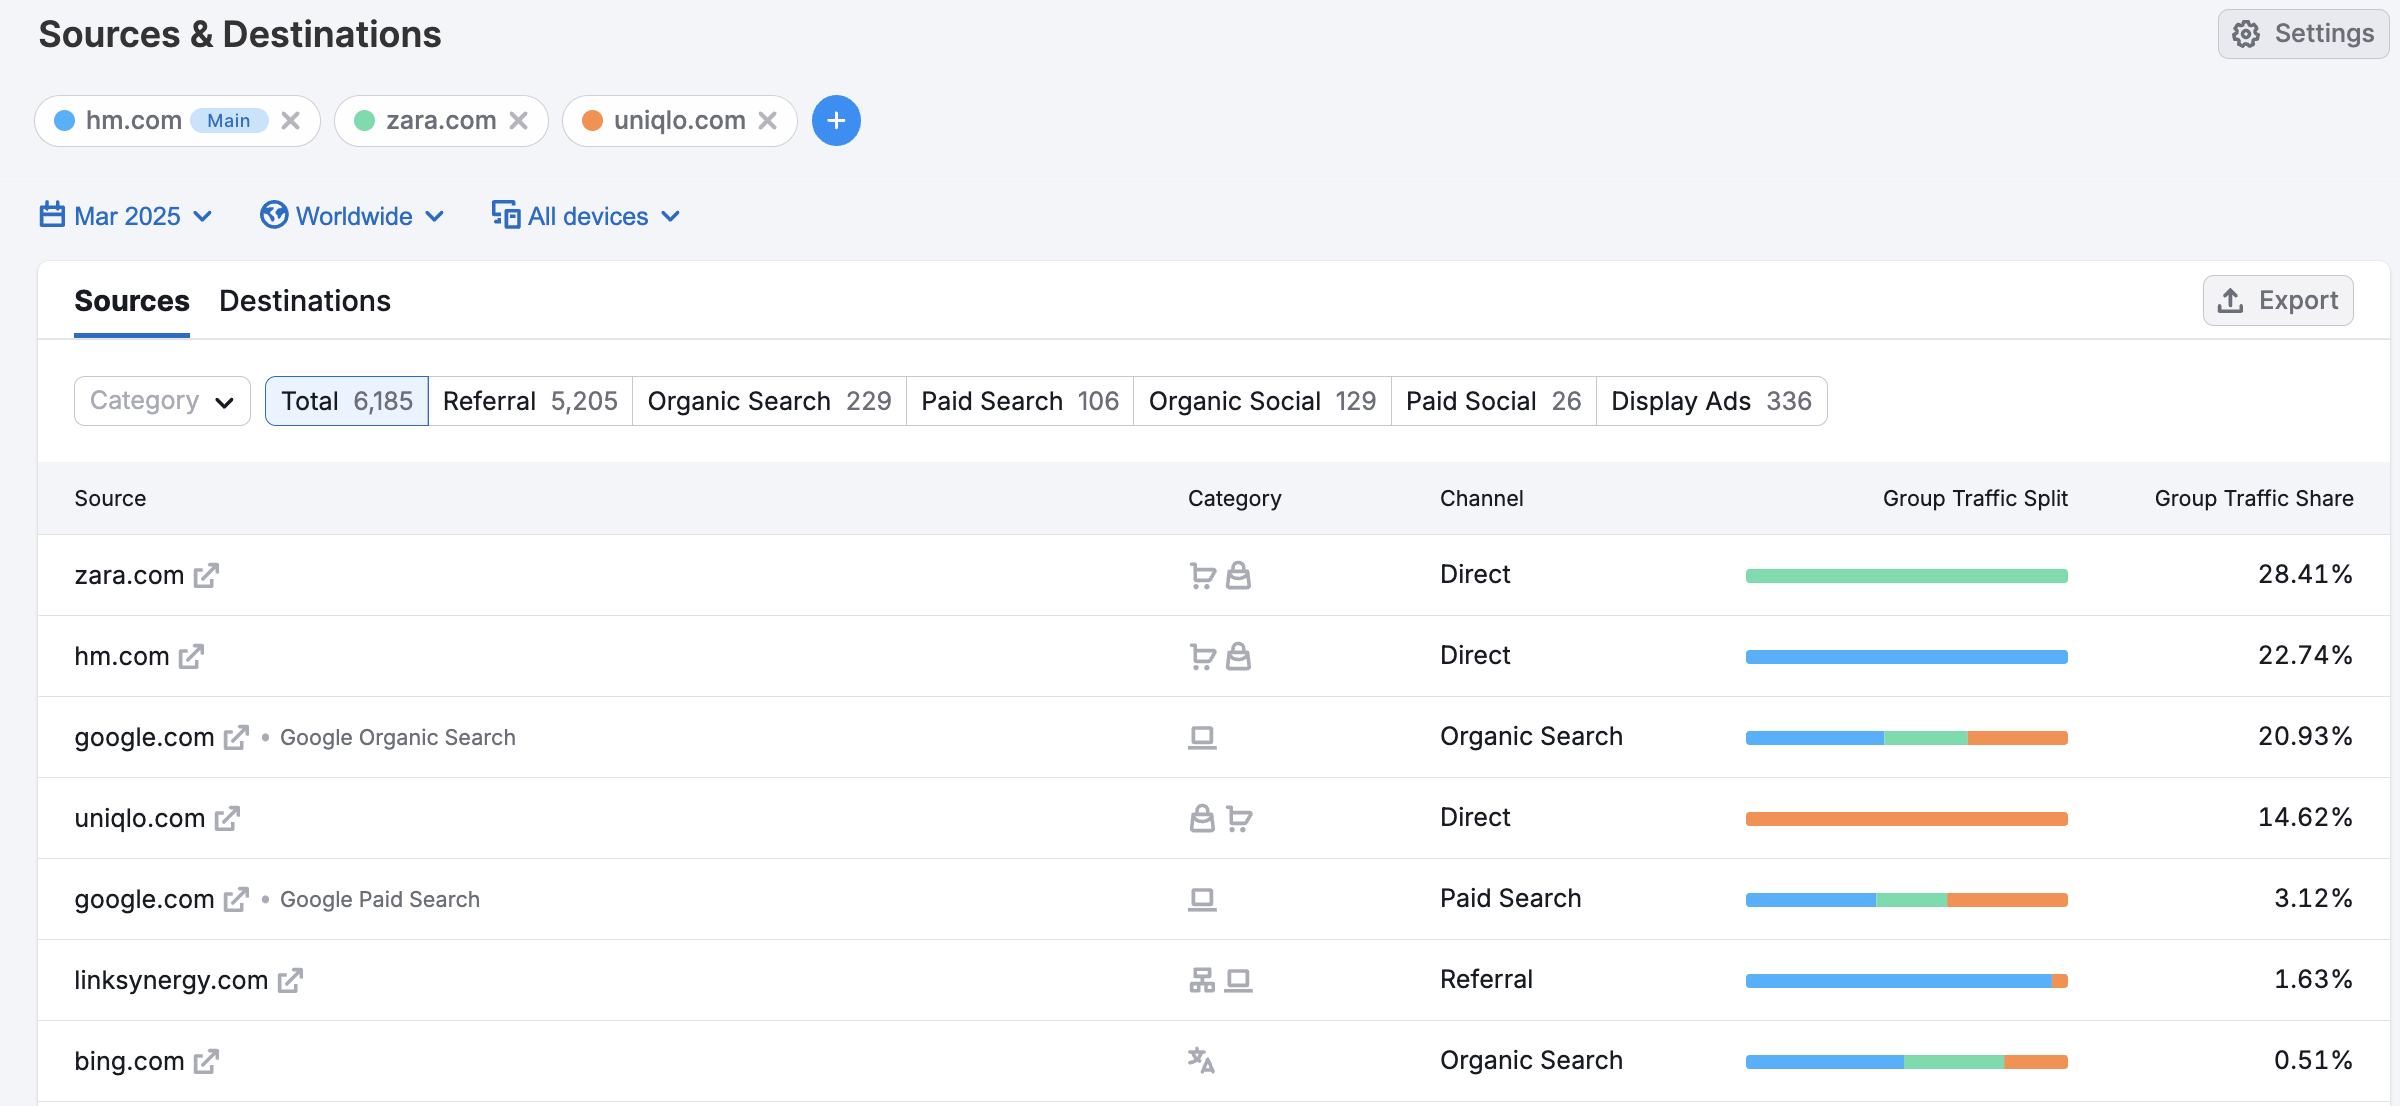
Use this dashboard to Identify high-impact referral sources, uncover partnership opportunities, and analyze post-visit behavior to refine your strategy.
Where does Semrush traffic data come from?
Traffic Analytics reports are based on petabytes of clickstream data that comes from multiple proprietary and 3rd party data sources, Semrush’s proprietary AI and machine learning algorithms, and Big Data technologies. The data is accumulated and approximated from the user behavior of over 200 million real internet users, and over a hundred different apps and browser extensions are used to collect it.
For more information about how Semrush turns traffic data into traffic intelligence, refer to our article here.
As Traffic Analytics data is not obtained from any website’s internal analytics, the numbers you see here might differ from what you see in your Google Analytics or similar trackers you use. However, if you want to analyze only your own website traffic without comparing it with others, we recommend that you refer to your own Google Analytics.
All numbers in Semrush Traffic Analytics are perfectly comparable, meaning you can match two or more websites in the tool and see how their metrics differ from each other in %.
What related Traffic & Market dashboards should I explore?
To expand your analysis, pair the Traffic Distribution dashboards with:
- Traffic Analytics Dashboard – To get a high-level view of total visits, engagement metrics, and traffic sources across all channels over time
- Daily Trends Dashboard – To monitor short-term shifts in traffic and channel performance on a day-to-day basis
- Top Pages, Subfolders & Subdomains – To explore which pages or site sections receive the most traffic and how users navigate through a site’s structure
- Sources & Destinations Dashboard – To visualize where users came from before visiting a domain and where they went after, helping you identify referral partners and exit paths
- Geo Dashboards – To segment traffic by U.S. state, assess regional engagement, and find growth opportunities by location
- Market Overview Dashboard – To compare domain performance to market benchmarks, assess share of voice, and track industry trends
- Audience Overlap Dashboard – To identify how much audience overlap exists between competitors and find unique or shared market reach opportunities